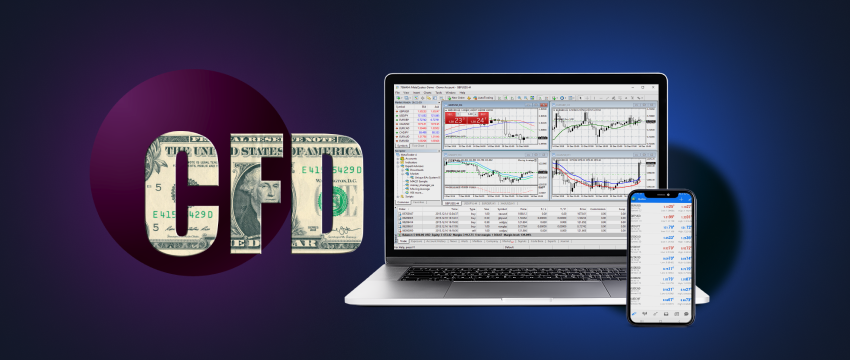
How to Read Charts and Indicators in T4Trade CFD Trading

Navigating the world of CFD (Contract for Difference) trading can be daunting, but mastering the art of reading charts and indicators can significantly enhance your trading strategy. t4trade cfd trading offers robust tools to help traders make informed decisions. Here’s a guide to understanding the basics.
Understanding Charts
Line Charts
Line charts are the simplest form of charts, displaying the closing prices over a specific period. They provide a clear, overall trend of the market without the noise of intraday fluctuations. Use line charts to identify long-term trends and support/resistance levels.
Bar Charts
Bar charts offer more detailed information, including the opening, closing, high, and low prices for a specific period. Each bar represents one period (e.g., one day), and the top and bottom of the bar indicate the highest and lowest prices, respectively. The left tick shows the opening price, while the right tick marks the closing price. Use bar charts for a more granular view of market movements.
Candlestick Charts
Candlestick charts are popular among traders due to their visual appeal and the depth of information they provide. Each candlestick shows the opening, closing, high, and low prices for a period. A filled (or red) candlestick indicates a closing price lower than the opening price, while an empty (or green) candlestick shows a higher closing price. Patterns such as Doji, Hammer, and Engulfing can signal potential market reversals or continuations.
Key Indicators
Moving Averages (MA)
Moving averages smooth out price data to identify trends. The two most common types are the Simple Moving Average (SMA) and the Exponential Moving Average (EMA). The SMA calculates the average price over a set period, while the EMA gives more weight to recent prices. Use moving averages to confirm trends and identify potential entry or exit points.
Relative Strength Index (RSI)
The RSI measures the speed and change of price movements on a scale of 0 to 100. Values above 70 indicate overbought conditions, while values below 30 suggest oversold conditions. Traders use RSI to identify potential reversal points and gauge market momentum.
Bollinger Bands
Bollinger Bands consist of a middle band (SMA) and two outer bands that are standard deviations away from the middle band. When the price touches the upper band, the market is considered overbought; when it touches the lower band, it is oversold. Bollinger Bands help traders identify volatility and potential reversal points.
Moving Average Convergence Divergence (MACD)
The MACD is a trend-following momentum indicator that shows the relationship between two moving averages of a security’s price. It consists of the MACD line, the signal line, and the histogram. Traders use MACD to identify potential buy and sell signals based on crossovers and divergences.
Conclusion
Mastering the art of reading charts and indicators in T4Trade CFD trading can significantly enhance your trading strategy. Start with the basics—line, bar, and candlestick charts—and gradually incorporate key indicators like moving averages, RSI, Bollinger Bands, and MACD. By understanding these tools, you’ll be better equipped to make informed trading decisions and navigate the complexities of the CFD market. Happy trading!